

State of the Internet in Sweden 2020-03-24 16:00
The Internet continues to work well in Sweden.
Since March 17, I have reported daily on the state of the Internet in Sweden. This was prompted by the many questions we were receiving about whether the Internet could cope with increased traffic, what would happen if schools were to close and, more specifically, what we had seen at the Internet Exchange when more people started to work from home.
The common theme in each of these posts has been that the Internet is working as expected. This is thanks to the upgrades and changes that have been made by Internet Service Providers (ISPs) and providers of related services.
As a result, we have decided to stop posting every day. We will, instead, post again when there are new things to say.
But in this post, I would like to explain why those of us working with the Internet are not as worried as people outside the industry seem to be. Over the years, there have been those who viewed the Internet as a series of tubes. The more I think about it, the more I agree with that view. The tubes have a certain capacity, and that is the maximum capacity. As long as the amount of traffic is lower than that maximum capacity, things just work.
Looking at our current situation, I want to give an idea of how full these “tubes” have been during this month: I want to demonstrate that networks are built with maximum usage, often referred to as “peak usage”, in mind. This means that if the actual traffic is lower than the peak, no changes are needed. Design is based on peaks, and peaks tend to be much above normal usage. They occur when new versions of games and operating systems are released.
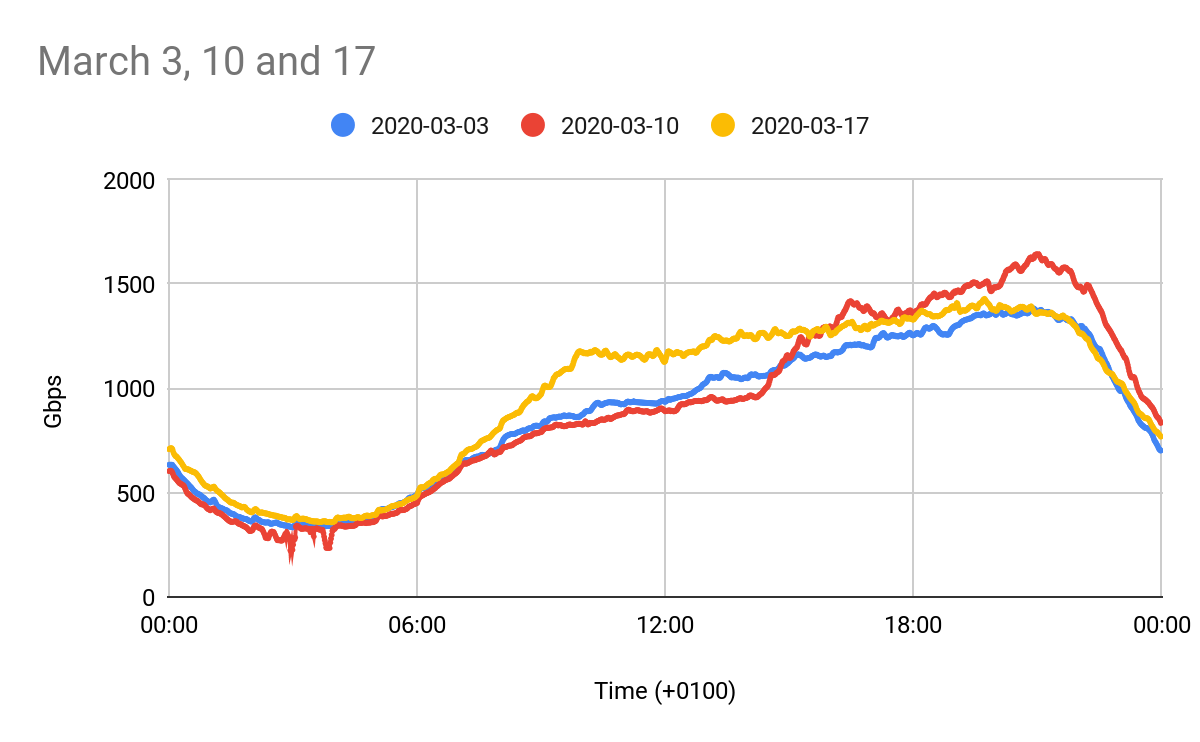
Let me give an example using some recent data. First, look at the blue line. It shows traffic over the Netnod Internet Exchange (IX) on March 3 which was a normal Tuesday. People go to work in the morning and when they come home they start watching videos using streaming services, do online gaming and whatnot. The highest traffic is clearly in the evening.
The yellow line shows Tuesday, March 17. This was the day that the Public Health Agency of Sweden recommended that people work from home, not visit elderly people and that people should stop travelling to or from Stockholm and other large cities. What we see on this yellow line is a traffic pattern like the blue line, but with more usage during the daytime. The most likely explanation is that more people were working remotely.
Now, look at the red, which is interesting. It is from March 10 when the game Call of Duty Warzone was released. This was one of those special moments when an exceptional amount of traffic was generated. What is noticeable is that the maximum usage (the peak usage) is much higher than the rest of the curve and higher than any point of the yellow line.
As the network is designed to handle peaks, such as the one we see on the red line, the increased usage during daytime that we have seen since March 17 has not impacted the efficient functioning of the networks.
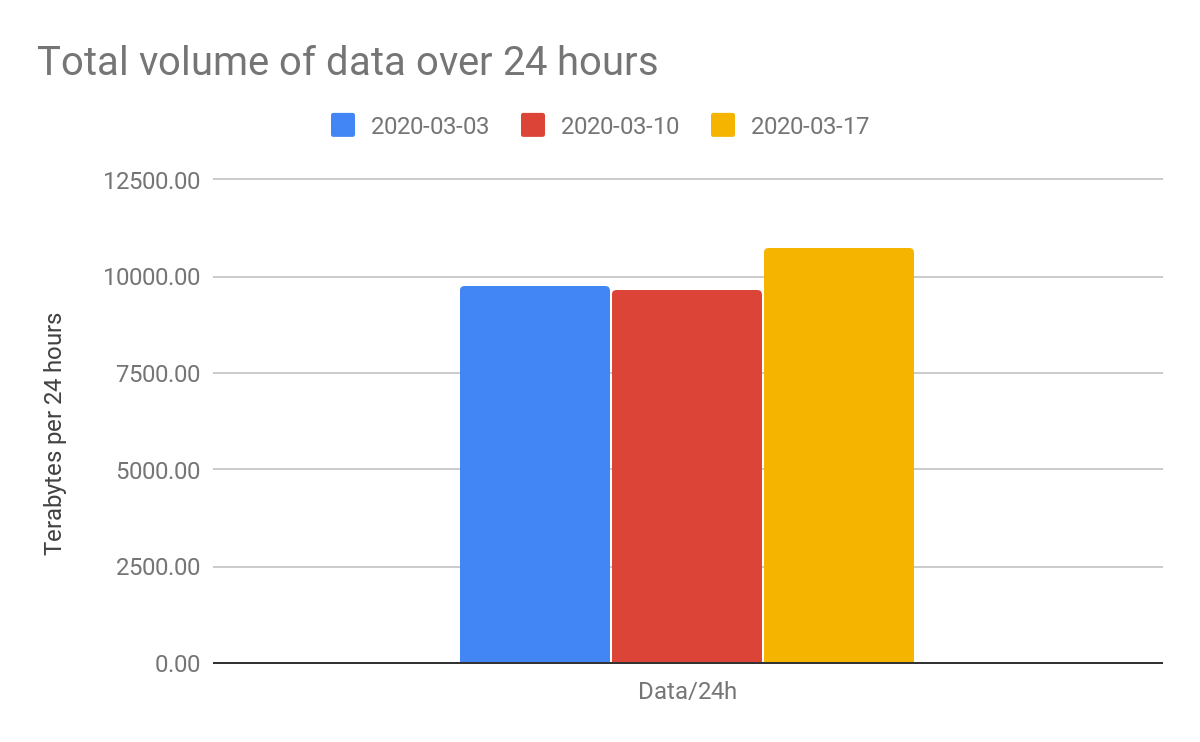
If we look at the total amount of data (i.e. not bandwidth) that moved over the Netnod IX during 24 hours for the three days, we find: 9 739 Terabytes on March 3; 9 626 Terabytes on the 10th; and 10 741 Terabytes on the 17th. This suggests that on the day with the largest peak, the 10th, we had the lowest total usage over 24 hours. We also see that the traffic on the 17th was 11% higher, but as it is a lower peak, it did not impact the functioning of the networks.
This is what we and others mean when we talk about “change of usage patterns”. There are of course connections and links in Sweden which have had peaks higher than before, specifically connections to services, but upgrades of those have worked well.
I hope this post has made things a bit clearer, and that I have managed to explain the difference between increased usage and design based on peak usage. And once again, because things continue to work well, I will hold off on posting more updates here unless we see something of particular interest and worth sharing.
If you have any more information available that you’d like to share, please contact me via email at paf+si@netnod.se.
Patrik Fältström
Technical Director and Head of Security
Netnod
About Netnod
Netnod provides critical infrastructure support ranging from interconnection services and Internet Exchanges to DNS services, root server operations and activities for the good of the Internet. With a worldwide reputation for its services and the expertise of its staff, Netnod ensures a stable and secure Internet for the Nordics and beyond. Established in 1996 as a neutral and independent Internet infrastructure organisation, Netnod is fully owned by the non-profit foundation TU-stiftelsen (Stiftelsen för Telematikens utveckling).
More information is available at: www.netnod.se